Virtual Reality Software Revenue Forecasts 2014 – 2018
This is our third post in the series presenting our market sizing forecast for the Consumer Virtual Reality sector. In the first post we scoped out addressable markets, HMD (and input device) penetration rates and unit sales. HMD and input device revenues were presented in the second post. Completing our market sizing forecast from 2014 to 2018, this article looks at revenues from the software side. Order the full market sizing report here.
Within the general category of ‘software revenue’ we include the following:
- Revenues from Virtual Reality games: A combination of monthly access subscriptions and in-game microtransactions (MTX). As some background, we’ve been analysing these types of game revenues from virtual worlds and MMOs since 2006.
- Revenues from Social Virtual Reality applications: Primarily access-driven virtual goods revenues as well as decorative/functional virtual goods popular within social worlds. Virtual goods is another revenue segment we have a deep understanding of.
- Revenues from real-world video applications: Based around the video capture of live events (sports, music etc) and presentation via VR, this is a revenue stream expected to be driven via MTX. We include LifeLogging within this software revenue segment.
HMD Owner to Active User Ratio
Our starting point to forecast software revenues is to assess the relationship between HMD owners and active users. We believe the virtual reality sector is very much a ‘Check this out!’ concept, meaning HMD owners will actively promote and advocate using their headsets to other people. Furthermore, within the timeframe of our forecast (2014 to 2018) we expect HMD ownership to mirror game consoles, i.e. one console to several ‘users’ within a household. On this basis, shown below is our forecast for the HMD to active user ratio.

On an average basis we forecast the HMD to active user ratio to grow from 1.0 in 2014 through to 2.4 in 2016 then dip slightly to 2.05 by 2018. Of the three primary target markets we’ve segmented our forecast by, the Early Majority (including the Kids, Tween and Teen market) possesses the highest ratio as this group is most likely to contain families. The corresponding ratio for this segment peaks at 3.0 during 2015/6, falling to 2.5 from 2017 onwards.
Active Users
By applying our HMD to Active User ratio with our HMD Unit Sales forecast we can derive the Active User base for Consumer Virtual Reality. This is shown in the chart below.

From a starting point of 200k active users in 2014 we forecast the base to grow to 6.9m in 2015, with the KT&T/Early Majority group being the dominant segment in overall active user terms. As indicated in the HMD Unit Sales forecast and revenue analysis, we view 2016 as a step-change year in VR and the active user base increases accordingly to 42.8m. By 2018 we forecast over 170m global active users of Consumer Virtual Reality.
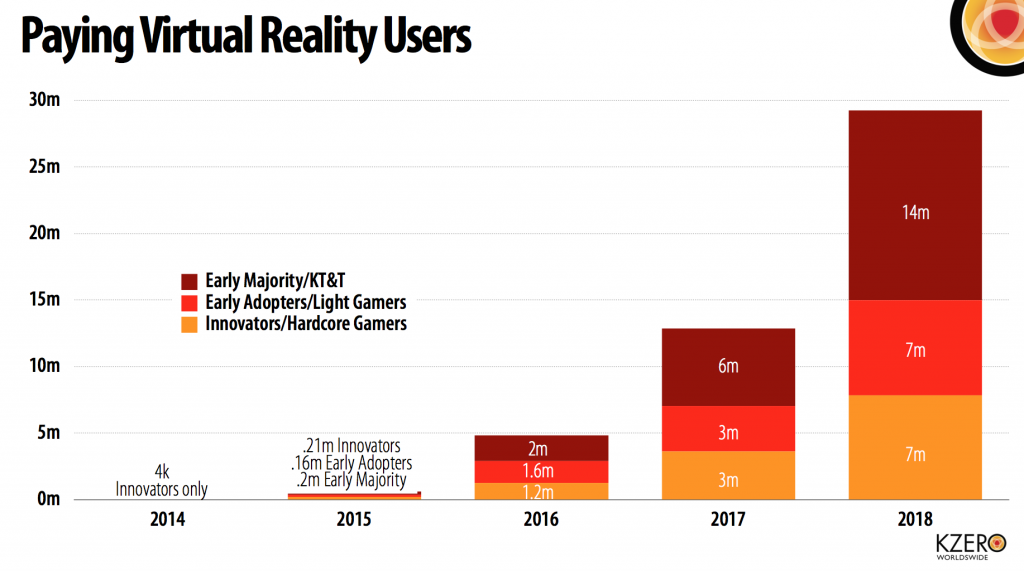
Paying Users
Of course, not every active user will be a paying user, although we expect the paying user conversion rate (the % of active users who are paying) to differ between the three primary markets. The Innovator/Hardcore Gamer segment is predicted to have the highest paying conversion rates reaching 20% in 2015 and growing through to 50% by 2018.
On an average basis (taking into account the two other segments of Early Adopters/Light Gamers and Early Majority/KT&T), we forecast a 8.5% paying conversion rate in 2015, rising to 11.2% in 2016. By 2018 we anticipate the average paying user conversion rate to reach 17.1%. Annual growth in the paying user conversion rate is shown below.

We can derive the paying user forecast by applying the active user base to the paying user conversion. Annual paying users for Consumer Virtual Reality software is shown below. By 2018 we forecast 29.2m paying users.
ARPPU
In order to forecast ARPPU (Average Revenue per Paying User) we have drawn heavily on our experience and insight from the virtual world, MMO and social gaming sectors. The market segment we expect to be most dominant from an ARPPU perspective is unsurprisingly the Innovator/Hardcore Gamer market, tracking in the $20 – $30 per month range during our forecasted time period.
The Early Adopter/Light Gamer segment is forecasted to peak at $20 in 2015 and then fall year on year down to $12.50 in 2018. The Early Majority/KT&T market is predicted to have relatively flat growth, tracking in the $10 – $12.50 range. The chart below shows annual ARPPU by type.

Software Revenues
Taking into account all factors explained above, from a modest start of yielding software revenue of $960k in 2014, we forecast the market to yield revenues of $129m in 2015 as the first commercial games and apps come to market to support the growing number of HMDs available.
In 2016 (the step change year) we anticipate software revenues to reach $1bn. By 2018 our forecast calculates annual revenues for VR software to hit at $4.6bn. On a cumulative basis from 2014 to 2018 our market sizing analysis predicts total software revenues of $8.4bn. The chart below shows annual Consumer VR software revenues from 2014 to 2018. Order the full market sizing report here.

Further information:
